- Published on
Climate Change’s impact on rainfall timeseries

Because of human-driven carbon emissions, in the next decades many locations around the world will experience changes in climate. One of the major expected effects of climate change is the variation in precipitation patterns. Projected changes may change from site to site, but in many places, climate models point to a variation (usually increase) of frequent dry days and high-intensity rainfall events.
Wastewater treatment facilities design needs to be aware of these precipitation changes, given that during extremely intense rainfall events the plant reaches maximum capacity and water must be discharged onto water bodies without treatment, potentially affecting the surrounding environment and the local population’s health.
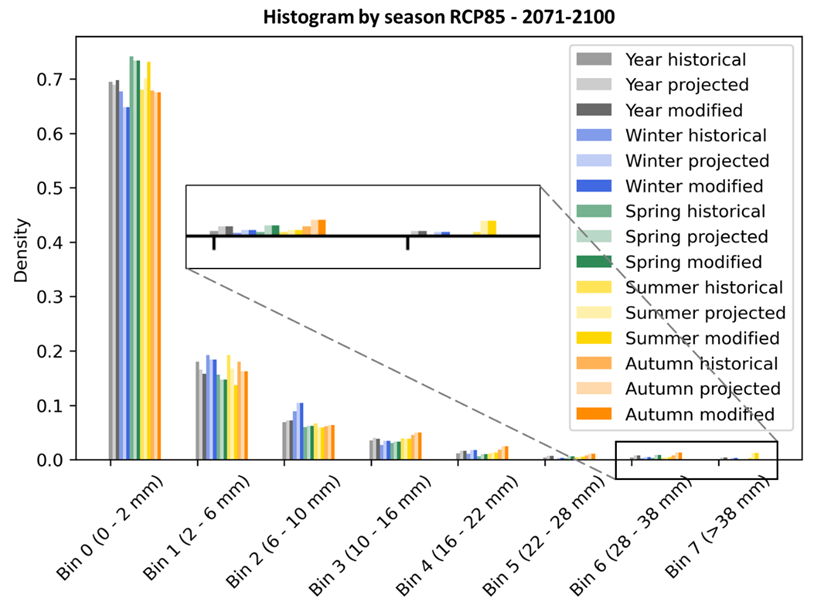
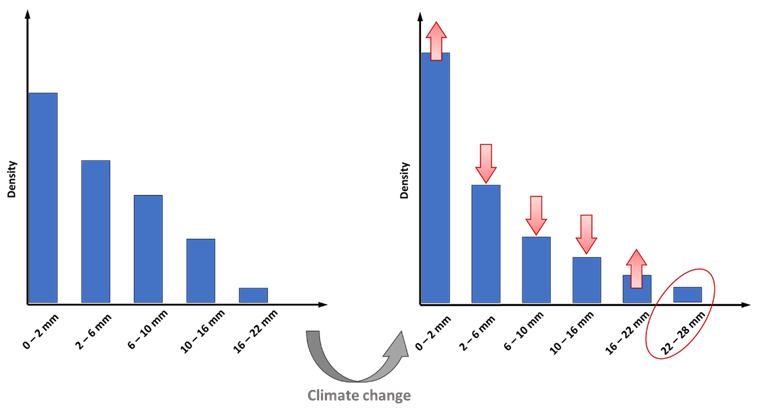
Precipitation intensity histograms are used to represent the density of rainfall events. The left chart in Figure 1 represents the daily historical rainfall data histogram for a specific site, while the right chart represents the histogram considering projected climate change. In this figure can be observed that, for this site, extreme events (dry periods, without precipitations, and intense precipitation, with 16 – 22 mm) will occur with higher frequency, while average precipitations (2 – 16 mm) will decrease in frequency. Moreover, projections which consider the effects of climate change foresee the occurrence of new intense rainfall (>22 mm of rain). This information is key to seize parameters for designing wastewater treatment plants.
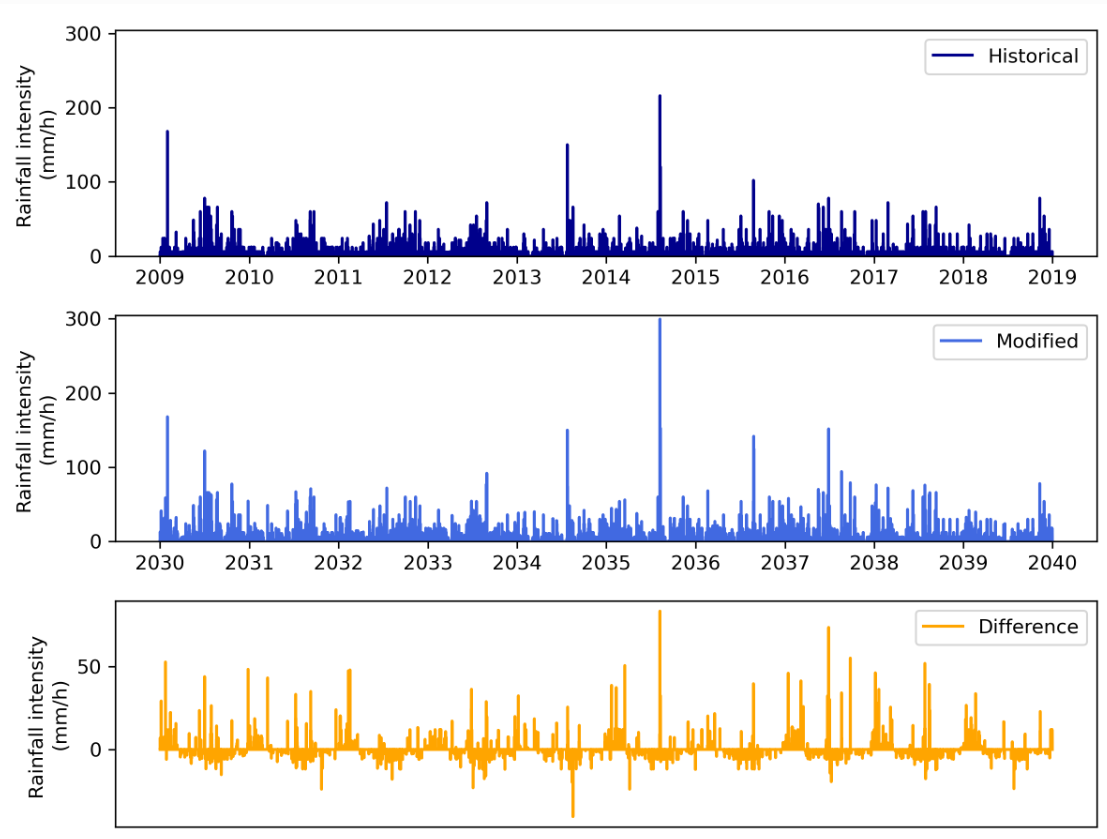
This pattern change information can be obtained from climate models at daily scale, maximum at 3hr for high precision models. This time granularity, however, is not valid for wastewater design modelling, which requires around 5-minute data to correctly handle the water discharged onto facilities. Therefore, design engineers and wastewater treatment plant managers are interested in obtaining sub-daily rainfall time series which handle the projected effects of climate change. For this reason, Amphos 21 has developed a software that transforms existing historical sub-daily precipitation time series (RED files) into sub-daily precipitation time series that emulate future rainfall patterns, with the possibility of adapting them across various time horizons and climatic scenarios (RCPs). The algorithm primarily consists of three steps:
- Download regional climate model datasets as source of information of future rainfall series, for all scenarios and time horizons desired.
- Uplift factor calculation, that determines a scaling factor of climate projections compared to historical data.
- Uplift sub-daily series, that modifies historical RED sub-daily time series to fit projected rainfall patterns using the scaling factor.
The main variables of interest to be used when adjusting projected rainfall patterns are:
- The number of dry days. Defined in as days with less than 1 mm of precipitation.
- The distribution of rainfall intensity, defined by its histogram bins at a daily scale.
- The total precipitation. Defined as the accumulated precipitation in mm during a period.