- Published on
Non-isothermal flow of CO2 in injection wells: evaluation of different injection modes
- Authors
Author
- Name
- Orlando Silvamail

Background
During the injection of carbon dioxide (CO2), the fluid density within the injection pipe could vary significantly along the well in response to pressure and temperature variations, thus affecting the CO2 injection rate at the reservoir depth. Among other reasons, understanding the behavior of CO2 flow through injection and monitoring wells is crucial because: (i) CO2 flow through the injection wells is the linking step between transport and storage (Nimtz et al., 2010); (ii) the adopted injection strategy may affect significantly the energy consumption and efficiency of CO2 geological storage (Vilarrasa et al., 2013); (iii) design and control of the operation both at pilot and industrial scale. Flow of CO2 in non-isothermal wells involves solving the partial differential equations (PDE) that express energy, mass and momentum conservation. These PDEs are coupled through equations of state (EOS) governing fluid and thermodynamic properties (Lu and Connell, 2014; Silva, 2015).
Modeling CO2 injection
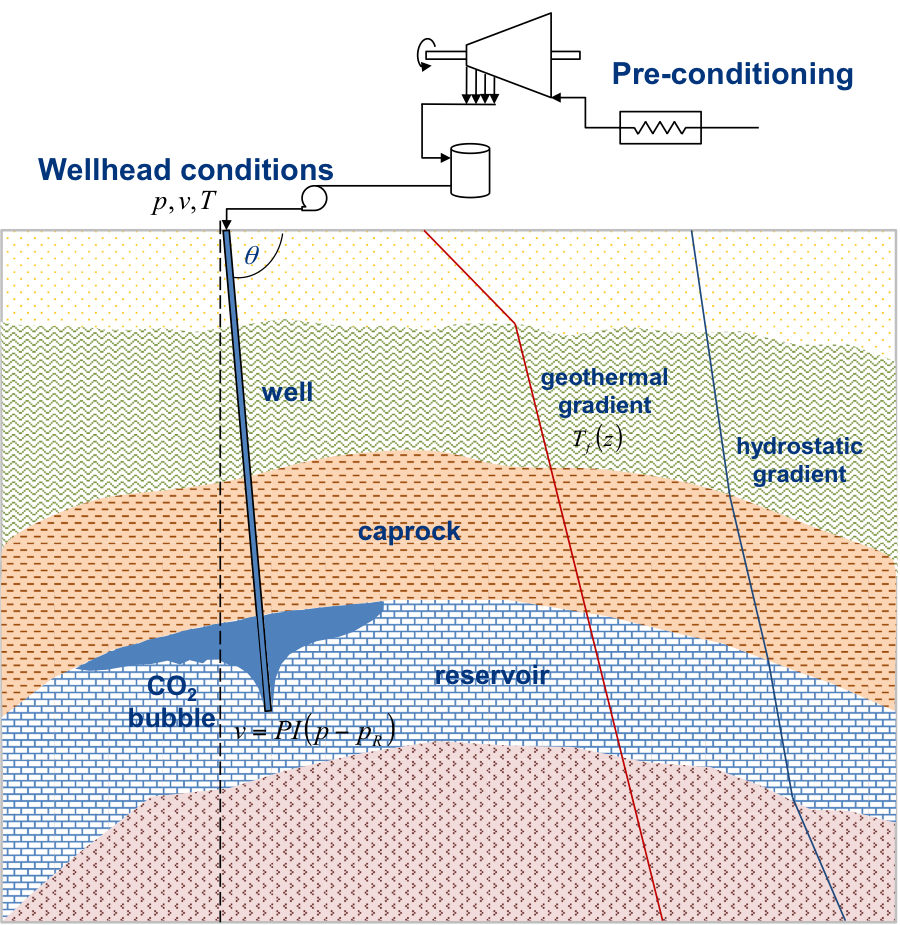
A one-dimensional (1D) model for non-isothermal single-phase flow of CO2 through injection wells was developed in Comsol Multiphysics and applied to evaluate different injection modes and hypothetical CO2 injection scenarios (Silva, 2015). The implementation methodology follows the approach of Lu and Connell (2014), in which the flow equations are based on the averaged-flow model (Hasan and Kabir, 2002). This model can be used for the assessment of several injection modes by comparing different operating conditions at the wellhead, which can represent hypothetical scenarios of CO2 pre-conditioning at surface.
Energy consumption
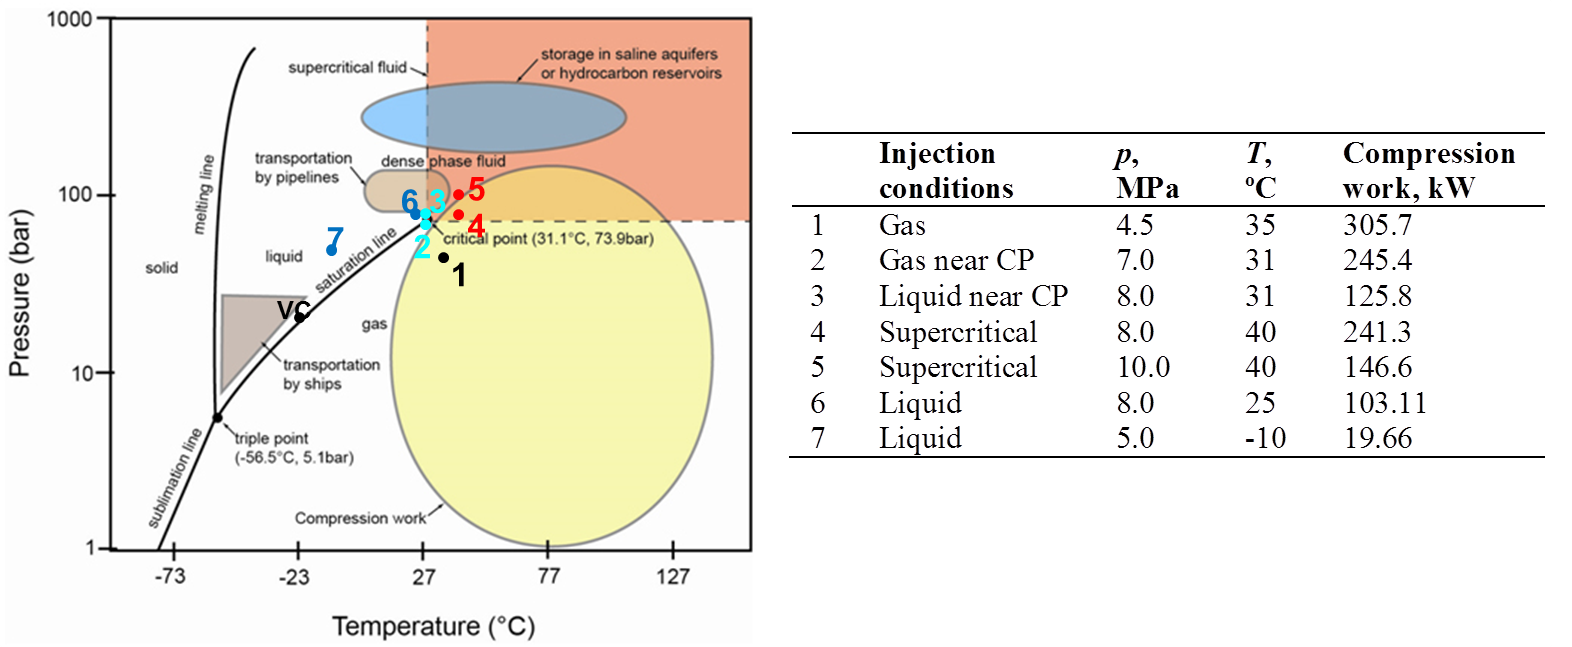
The energy consumption due to surface conditioning operations varies for each injection mode and can be roughly estimated by the difference of specific enthalpy between wellhead and storage vessel conditions (Vilarrasa et al., 2013). The table below shows the energy consumption for seven CO2 injection conditions at the wellhead: gas, gas and liquid near the critical point (CP), supercritical (SC) (8 and 10 MPa), liquid at high p and T, liquid at low p and T (storage vessel at 2.0 MPa and -20 ºC; injection flowrate of 1.0 kg/s). As suggested by the CO2 phase diagram, the compression work is higher when injecting CO2 in gas-phase, near critical and SC conditions at the wellhead. On the contrary, injecting CO2 in liquid-phase reduces substantially the energy consumption because pumping/compression is easier and heating is minor.
Flow behavior through the well
As petroleum and geothermal engineers well know, the injection/extraction conditions at the wellhead can have a significant impact on the flow behaviour through the wellbore. The same occurs during the CO2 geological storage. The figure below shows the temperature, pressure, velocity and density profiles obtained in steady state for each injection mode. Injecting gaseous CO2 causes very low densities through the wellbore. CO2 injection in gaseous near the CP and SC (8 MPa) conditions increase density but at the bottom this is still lower than 600 kg/m3. By contrast, injecting liquid near the CP and SC (10 MPa) conditions lead to higher bottomhole densities, comparable to those reached by injecting liquid CO2. Higher CO2 densities are advantageous because are closer to the density of the resident brine, which reduce buoyancy effects in the reservoir and the potential risks of caprock failure and subsequent CO2 leakages.
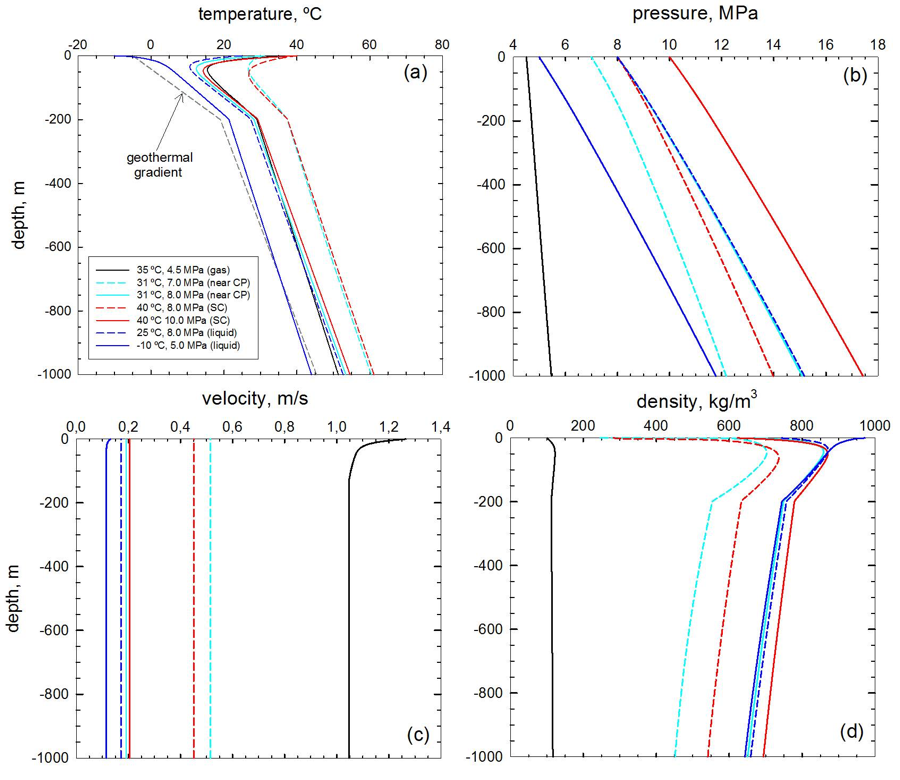
Note that the fluid within the injection pipe tends to equilibrate with the geothermal gradient. Transient simulations reveal that steady state is reached faster by injecting at higher pressures. In particular, steady state flow conditions are obtained after 1 hour when injecting SC CO2 at the wellhead. By contrast, operational equilibrium is reached only after 100 days by injecting gaseous or liquid CO2 at low pressure (see the video below).
Fluctuating injection regime
Injecting CO2 at variable flowrate can help to increase considerably the density of CO2 at the bottomhole. A fluctuating injection regime was defined by a piecewise function in Comsol (see the figure below), such that the total mass of injected CO2 during 100 days is equal to the mass injected at a constant rate of 1.0 kg/s in the same period (8640 ton of CO2).
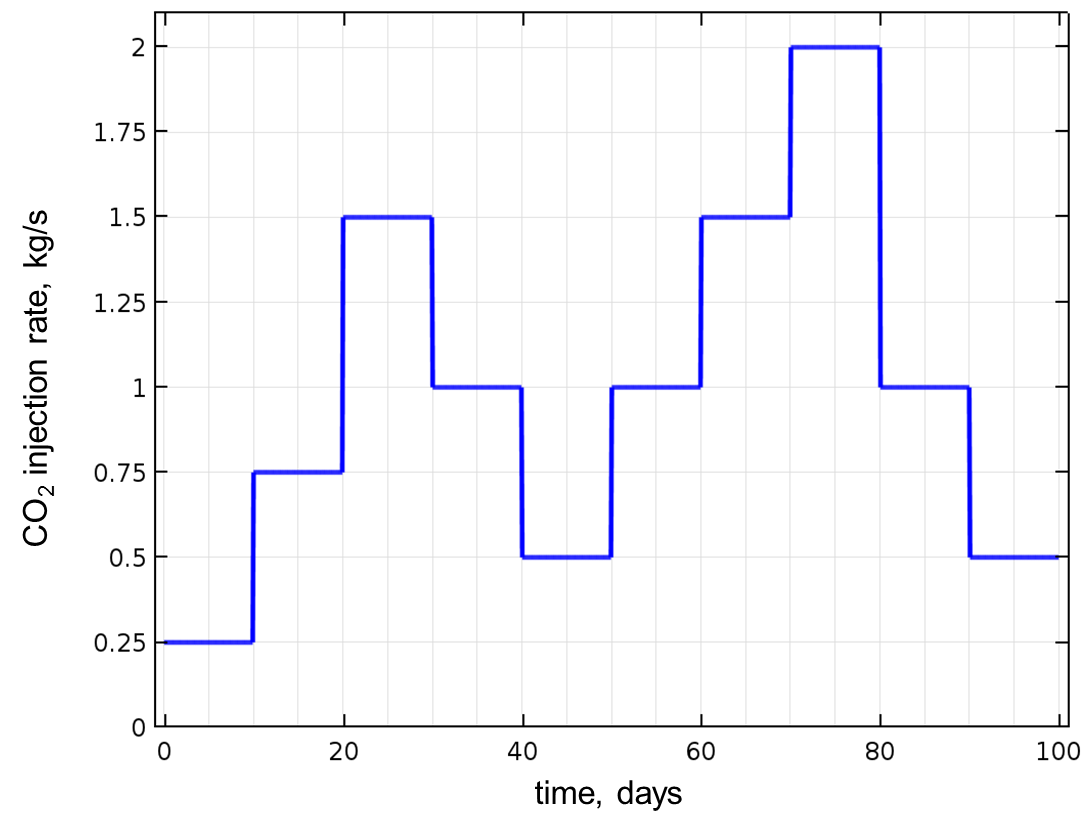
The video below shows that an average density increase of about 18% is obtained at the bottomhole, despite there are periods in which CO2 heating due to the friction within the injection pipe can induce a notorious density reduction. Nevertheless, it has been demonstrated that a fluctuating injection regime can enhance CO2 dissolution into the resident brine of the storage aquifer (Hidalgo and Carrera, 2009). Therefore, the present simulation shows that this injection mode has the double advantage of reducing the pressure within the reservoir and improving the efficiency of CO2 storage.
Pressure-controlled injection
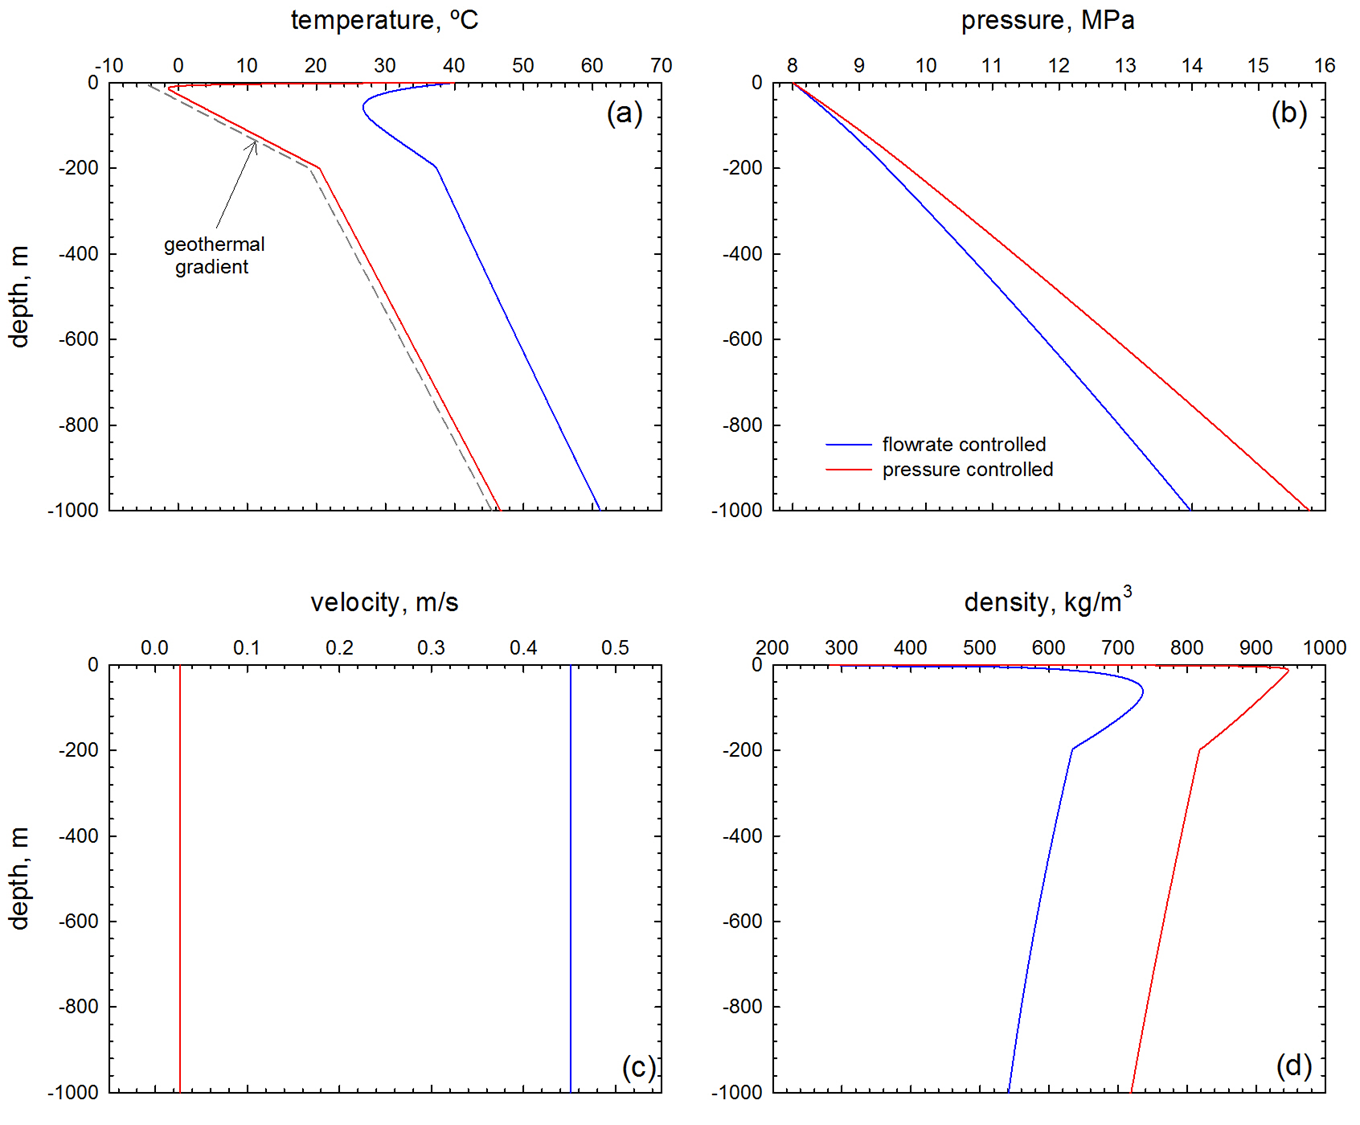
Pressure-controlled injection may be more realistic operating conditions. Still, it provides a way for coupling models of CO2 flow through the well and multiphase flow and transport of CO2 through the geological formations (reservoir and caprock). Nevertheless, pressure-controlled injection causes variable mass injection flowrates, which can reduce substantially the storage efficiency. A comparison between the steady state temperature, pressure, velocity and density profiles obtained under flowrate-controlled injection and pressure-controlled injection with a constant reservoir pressure of 10 MPa is presented in the figure below. Due to the lower heating (a) and the higher pressures (b) developed through the injection string, the CO2 density increases significantly under pressure-controlled injection (d). However, the higher density is compensated by a reduction of the injected mass of CO2. The velocities decrease in more than one order of magnitude (c), which results in a total injected mass of CO2 of about 1322 ton in 100 days.
The situation can be even worse when considering the effect of a dynamic reservoir pressure. The increase of the reservoir pressure due to the evolution of a CO2–rich phase within the storage formation reduces the injection rate. However, the CO2 densities through the injection well are substantially increased, as a consequence of the stronger cooling of the well. This is due to the lower velocities that allow CO2 to exchange heat with the surrounding for longer times.
Conclusions
Wellhead conditions of CO2 below the critical point cause low fluid densities through the injection pipe. Conversely, injecting liquid CO2 or CO2 at high pressure helps to increase the density at the bottomhole, which has added benefits for the efficiency and security of the geological storage. Moreover, steady state is reached faster by injecting at high pressures. Higher densities at the bottomhole can also be achieved by a fluctuating injection regime, which also has the advantage of enhancing the CO2 storage efficiency. Pressure-controlled injection may induce high densities as well, although at a reduced injected mass of CO2. It is concluded that CO2 injection conditions should be tuned considering a balance between optimal storage densities and the stability of the operation.
Acknowledgements
The support received from the MINECO (Torres Quevedo Programme) and the European Social Fund is very much acknowledged.
References
Hasan, A.R. and Kabir, C.S., 2002. Fluid flow and heat transfer in wellbores. SPE Richardson, TX, USA.
Hidalgo, J. and Carrera, J. 2009. Effect of dispersion on the onset of convection during CO2 sequestration, Journal of Fluid Mechanics, 640, 441-452.
Lu, M. and Connell, L.D., 2014. The transient behaviour of CO2 flow with phase transition in injection wells during geological storage, Journal of Petroleum Science and Engineering, 124, 7-18.
Nimtz, M., Klatt, M., Wiese, B., Kühn, M. and Krautz, H.J., 2010. Modelling of the CO2 process- and transport chain in CCS systems-Examination of transport and storage processes, Chemie der Erde, 70, 185-192.
Silva, O., 2015. Non-isothermal flow of CO2 in injection wells: evaluation of different injection modes. Comsol Conference 2015, Grenoble, https://www.comsol.it/2015-user-presentations/geophysics-and-geomechanics
Vilarrasa, V., Silva, O., Carrera, J. and Olivella, S., 2013. Liquid CO2 injection for geological storage in deep saline aquifers, International Journal of Greenhouse Gas Control, 14, 84-96.